The landscape of global higher education (HE) continues to shift remarkably. We have seen a remarkable expansion of HE in terms of the number of institutions and students. For the latter, the UNESCO Institute for Statistics estimates that in 1970 there were 33.1 million students enrolled in HE institutions compared to 100.19 million in 2001. By 2020, there were 236.1 million enrolments, with estimates showing that by 2040 there would be over 550 million students.
Over the past twenty years, we have seen significant shifts in enrolments across world regions. By 2002, there were more students enrolled in HE from North America & Europe than any other world region. By 2003, East Asia & the Pacific overtook North America & Western Europe both in highest volume and global share of enrolments. And by 2014, South & West Asia overtook North America & Europe as the third highest contributor of enrolments to the world.
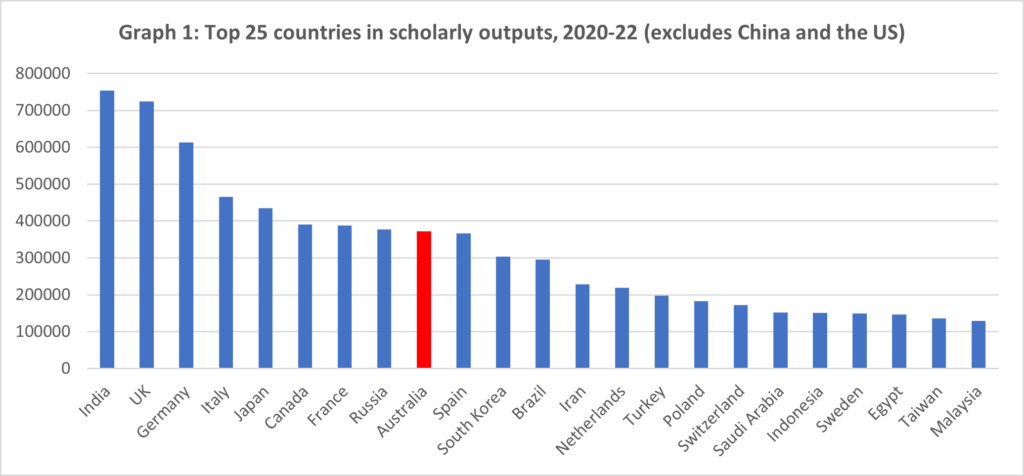
Another lens by which to view the changing landscape is to see how global science is changing across geographies. If we use scholarly outputs as proxy of science or knowledge, we see that over the 2020-2022 period China produced 2.6 million publications compared to 2.2 million for the United States. India is third globally and ahead of the United Kingdom, Germany, and Italy, followed by Japan, Canada, France, and Russia to complete the top 10 producers of scholarly outputs based on Elsevier’s Scopus database (see Graph 1).
Australia is ranked 11th globally in the volume of scholarly outputs, followed by Spain, South Korea, Brazil, and Iran. Of the world’s top 25 countries, 15 are outside North America and Western Europe.
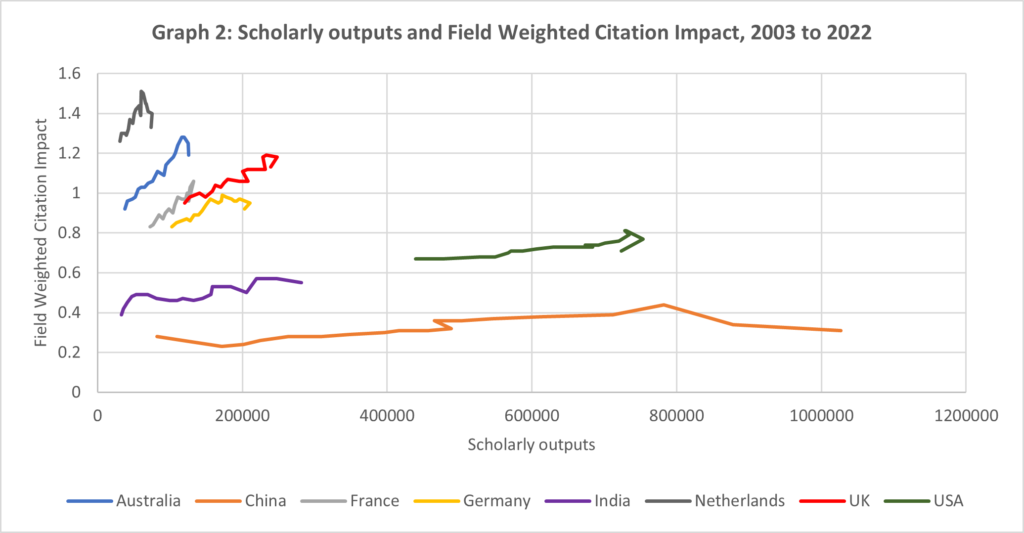
We can also see that while China has produced more publications for the past three years than the United States, it is lagging on impact (see Graph 2). For this purpose, I am using Elsevier’s Field Weighted Citation Impact (FWCI). The FWCI measure is expressed as the ratio of the total citations received by the denominator output and the total citations expected based on the average of the subject field.
It is clear that we are evolving from a bipolar world to a tripolar world. There is a shift away from North America & Western Europe and towards Asia & the Pacific. We are also witnessing that the Global North is accommodating to the rise of the Global South.
Whilst the dominance of the United States and Western European countries is steadfastly waning, China and India are yet to experience a climb in impact.
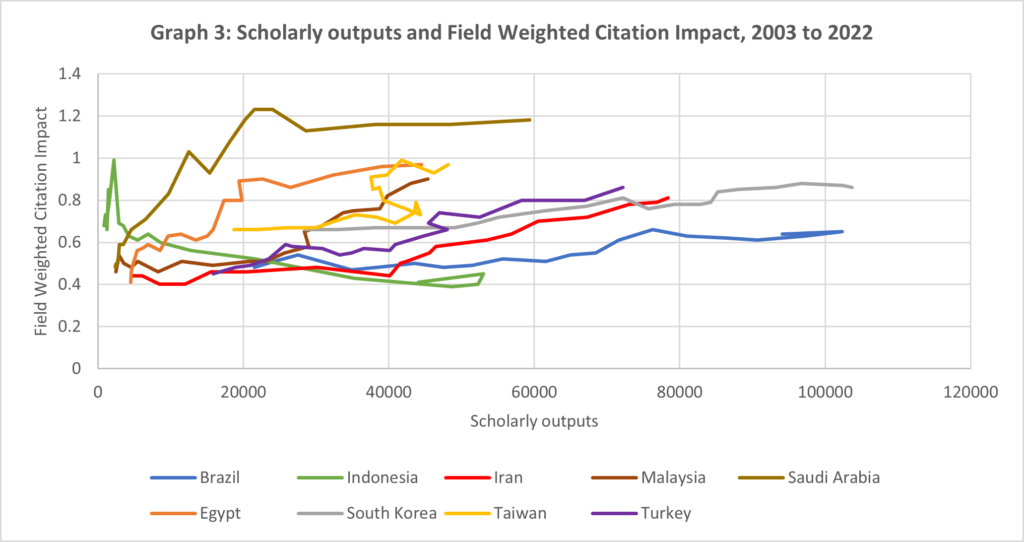
Over the past twenty years, we have seen that countries such as Egypt, Malaysia, Iran, and Saudi Arabia stand out because they have experienced strong growth in publications and a strong uplift in impact (see Graph 3). There are also other countries such as Brazil, South Korea, Taiwan, and Turkey, which have also experienced sustained uplift in publications and impact, although at a lower rate than those four standouts.
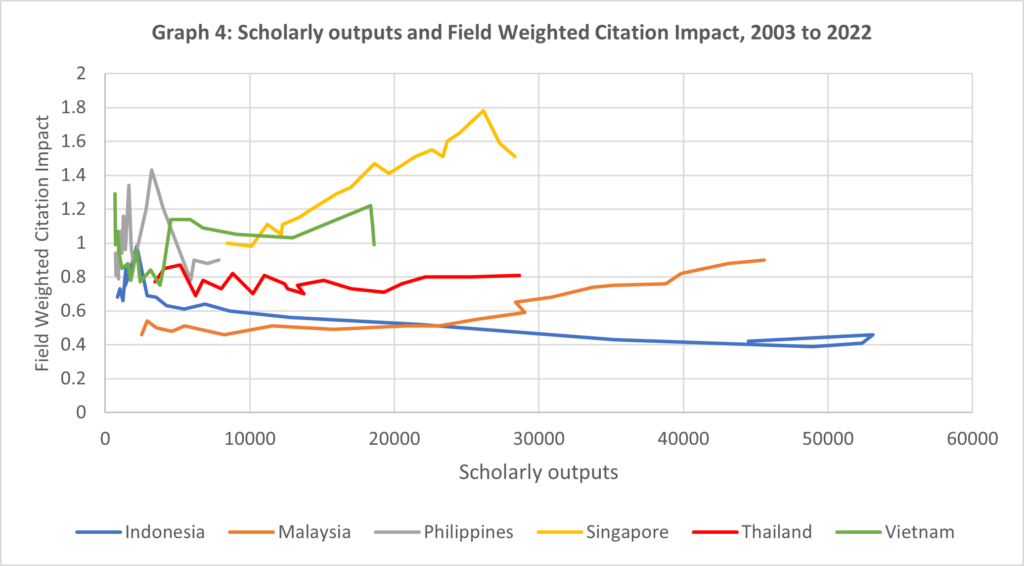
Among countries from Southeast Asia, Indonesia and Thailand have considerably increased volume of outputs but have experienced a decrease in impact over the past twenty years (see Graph 4). Singapore has the highest impact with the fourth largest volume of outputs. Vietnam has the second highest impact with a low volume of outputs.
Another way to demonstrate how the world is rapidly changing is to examine the level of expenditure in research and development. Using data from the UNESCO Institute for Statistics’ science, technology and innovation dataset, we see that the countries which we have identified as rising in the knowledge production stakes over the past 20 years have increased their overall Gross Expenditure on R&D (GERD) as a proportion of Gross Domestic Product (GDP).
For example, China’s GERD as a proportion of GDP has changed from 0.94 per cent in 2001 to 2.40 per cent in 2020, averaging a 5.1 percentage points increase per year. By contrast, the United States’ annual GERD as a proportion of GDP averaged a 1.4 percentage points increase over the 20- year period. In 2020, the United States reported 3.4 per cent of GERD as a proportion of GDP.
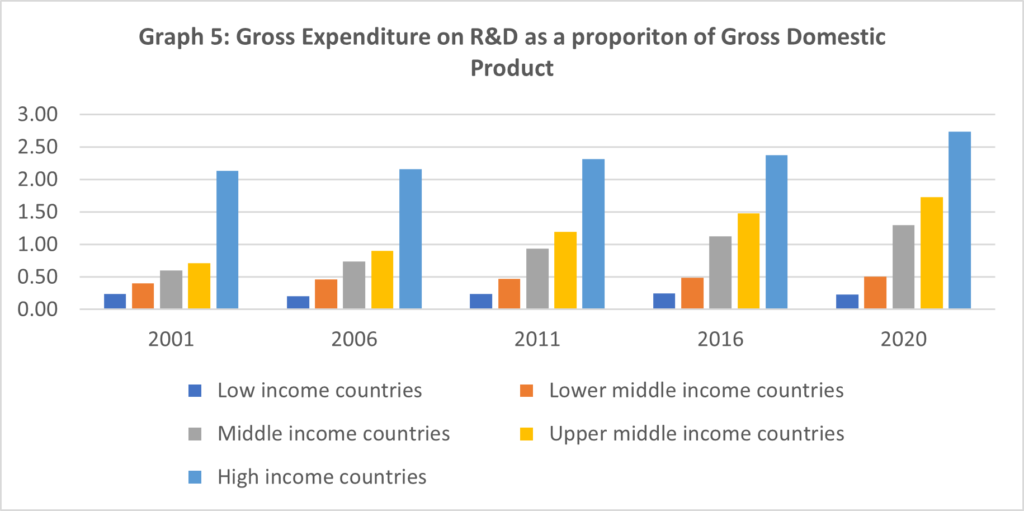
Over this 20-year period among high-income economies the GERD as a proportion of GDP increased on average by 1.3 percentage points each year. This proportion went from 2.1 per cent in 2001 to 2.7 per cent in 2020. By comparison, the equivalent performance for middle-income economies went from 0.6 per cent in 2001 to 1.3 per cent in 2020, averaging a 4.2 percentage points increase per year. Upper-middle income economies experienced an even stronger annual average growth of 4.8 percentage points per year, increasing from 0.7 per cent in 2001 to 1.7 per cent in 2020 (see Graph 5).
The geography of science and knowledge production will continue to be transformed as more countries recognize the importance of investment in HE, research training, and research and development. We are progressively seeing a shift to a multi-polar world order in all facets of human activity.
In this context, HE (but particularly academic research) has become pivotal in shaping government policies and enabling some countries to gain a competitive advantage over others. For Australia to remain competitive in the global stage, an increased investment in HE and research endeavors is clearly needed.